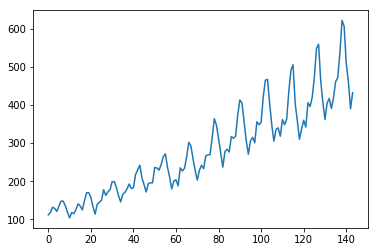
Data
Here, I'll use air passenger data, which is typical time-series data. You can download from the link below.
To make the point simple, I don't download the data on the code. So, I'll just go on with the premise that the data is already on your working directory. Anyway, at first, import the necessary libraries and load data.
import pandas as pd
import matplotlib.pyplot as plt
import statsmodels.api as sm
import pystan

data_loc = '/working_directory/AirPassengers.csv'
data = pd.read_csv(data_loc)

print(data.head())
Month #Passengers
0 1949-01 112
1 1949-02 118
2 1949-03 132
3 1949-04 129
4 1949-05 121It has two columns and what I need is the second column, #Passengers. So, from now on, I’ll focus on #Passengers column. By visualization, we can see this is typical time-series data.
ts_data = data['#Passengers']
plt.plot(ts_data)
plt.show()
Stan codes
On this article, I'll try four types of Stan codes. The models are following four.
- local level model
- local trend model
- local trend model for forecasting
- local linear trend model for forecasting
Mathematically, those are expressed as followings.
- local level model
- local trend model
- local linear trend model
local level model code
data {
    int N;
    vector[N] y;
    }

parameters {
    vector[N] u;
    real<lower=0> u_s;
    real<lower=0> y_s;
    }

model {
    u[2:N] ~ normal(u[1:N-1], u_s);
    y ~ normal(u, y_s);
}
local trend model code
data {
    int N;
    vector[N] y;
    }
parameters {
    vector[N] u;
    real<lower=0> u_s;
    real<lower=0> y_s;
    }
model {
    u[3:N] ~ normal(2 * u[2:N-1] - u[1:N-2], u_s);
    y ~ normal(u, y_s);
    }
local trend model for forecasting code
data {
    int N;
    int pred_Num;
    vector[N] y;
    }
parameters {
    vector[N] u;
    real<lower=0> u_s;
    real<lower=0> y_s;
    }
model {
    u[3:N] ~ normal(2 * u[2:N-1] - u[1:N-2], u_s);
    y ~ normal(u, y_s);
    }
generated quantities {
    vector[N + pred_Num] u_pred;
    u_pred[1:N] = u;
    for (t in 1:pred_Num){
        u_pred[N + t] = normal_rng(2*u_pred[N+t-1]-u_pred[N+t-2], u_s);
    }
}
local linear trend model for forecasting code
data {
    int N;
    vector[N] y;
    int pred_Num;
}

parameters {
    vector[N] u;
    vector[N] v;
    real<lower=0> s_u;
    real<lower=0> s_v;
    real<lower=0> s_y;
}

model {
    v[2:N] ~ normal(v[1:N-1], s_v);
    u[2:N] ~ normal(u[1:N-1]+v[1:N-1], s_u);
    y ~ normal(u, s_y);
}

generated quantities {
    vector[N + pred_Num] u_pred;
    vector[N + pred_Num] v_pred;
    vector[N + pred_Num] y_pred;
    u_pred[1:N] = u;
    v_pred[1:N] = v;
    y_pred[1:N] = y;
    for (t in 1:pred_Num){
        v_pred[N+t] = normal_rng(v_pred[N+t-1], s_v);
        u_pred[N+t] = normal_rng(u_pred[N+t-1]+v_pred[N+t-1], s_u);
    }
    for (t in 1:pred_Num){
        y_pred[N+t] = normal_rng(u_pred[N+t], s_y);
        }

}
Execute
We can execute the Stan code on Python by pystan.
At first, local model.
# local model
data_feed = {'N':ts_data.shape[0], 'y':ts_data}
fit_local_model = pystan.stan(file='local_model_1.stan', data=data_feed, iter=1000)

samples = fit_local_model.extract(permuted=True)
u_mean = samples['u'].mean(axis=0)

plt.plot(list(range(ts_data.shape[0])), ts_data)
plt.plot(list(range(len(u_mean))), u_mean)
plt.show()
Second, local trend model. As you can see, here I'm using same variable name by over writing. Practically, it is better to use other names.
# local trend model
fit_local_trend_model = pystan.stan(file='local_trend_model_1.stan', data=data_feed, iter=1000)

samples = fit_local_trend_model.extract(permuted=True)
u_mean = samples['u'].mean(axis=0)

plt.plot(list(range(ts_data.shape[0])), ts_data)
plt.plot(list(range(len(u_mean))), u_mean)
plt.show()
Third, local trend model for forecasting. On this model, predicted points made a calm line.
data_feed = {'N':ts_data.shape[0], 'y':ts_data, 'pred_Num': 100}
fit_local_trend_model = pystan.stan(file='local_trend_model_2.stan', data=data_feed, iter=1000)

samples = fit_local_trend_model.extract(permuted=True)
u_mean = samples['u_pred'].mean(axis=0)

plt.plot(list(range(ts_data.shape[0])), ts_data)
plt.plot(list(range(len(u_mean))), u_mean)
plt.show()
Fourth, local linear trend model for forecasting. Because I'm plotting the mean of the sampled points, we can see simple single line from the last observed points.
data_feed = {'N':ts_data.shape[0], 'y':ts_data, 'pred_Num': 100}
fit_local_linear_trend_model = pystan.stan(file='local_linear_trend_model.stan', data=data_feed, iter=1000)

samples = fit_local_linear_trend_model.extract(permuted=True)
u_mean = samples['u_pred'].mean(axis=0)

plt.plot(list(range(ts_data.shape[0])), ts_data)
plt.plot(list(range(len(u_mean))), u_mean)
plt.show()
About the term of the season, I'll try on next article.